Apple Silicon Profiler
Cores
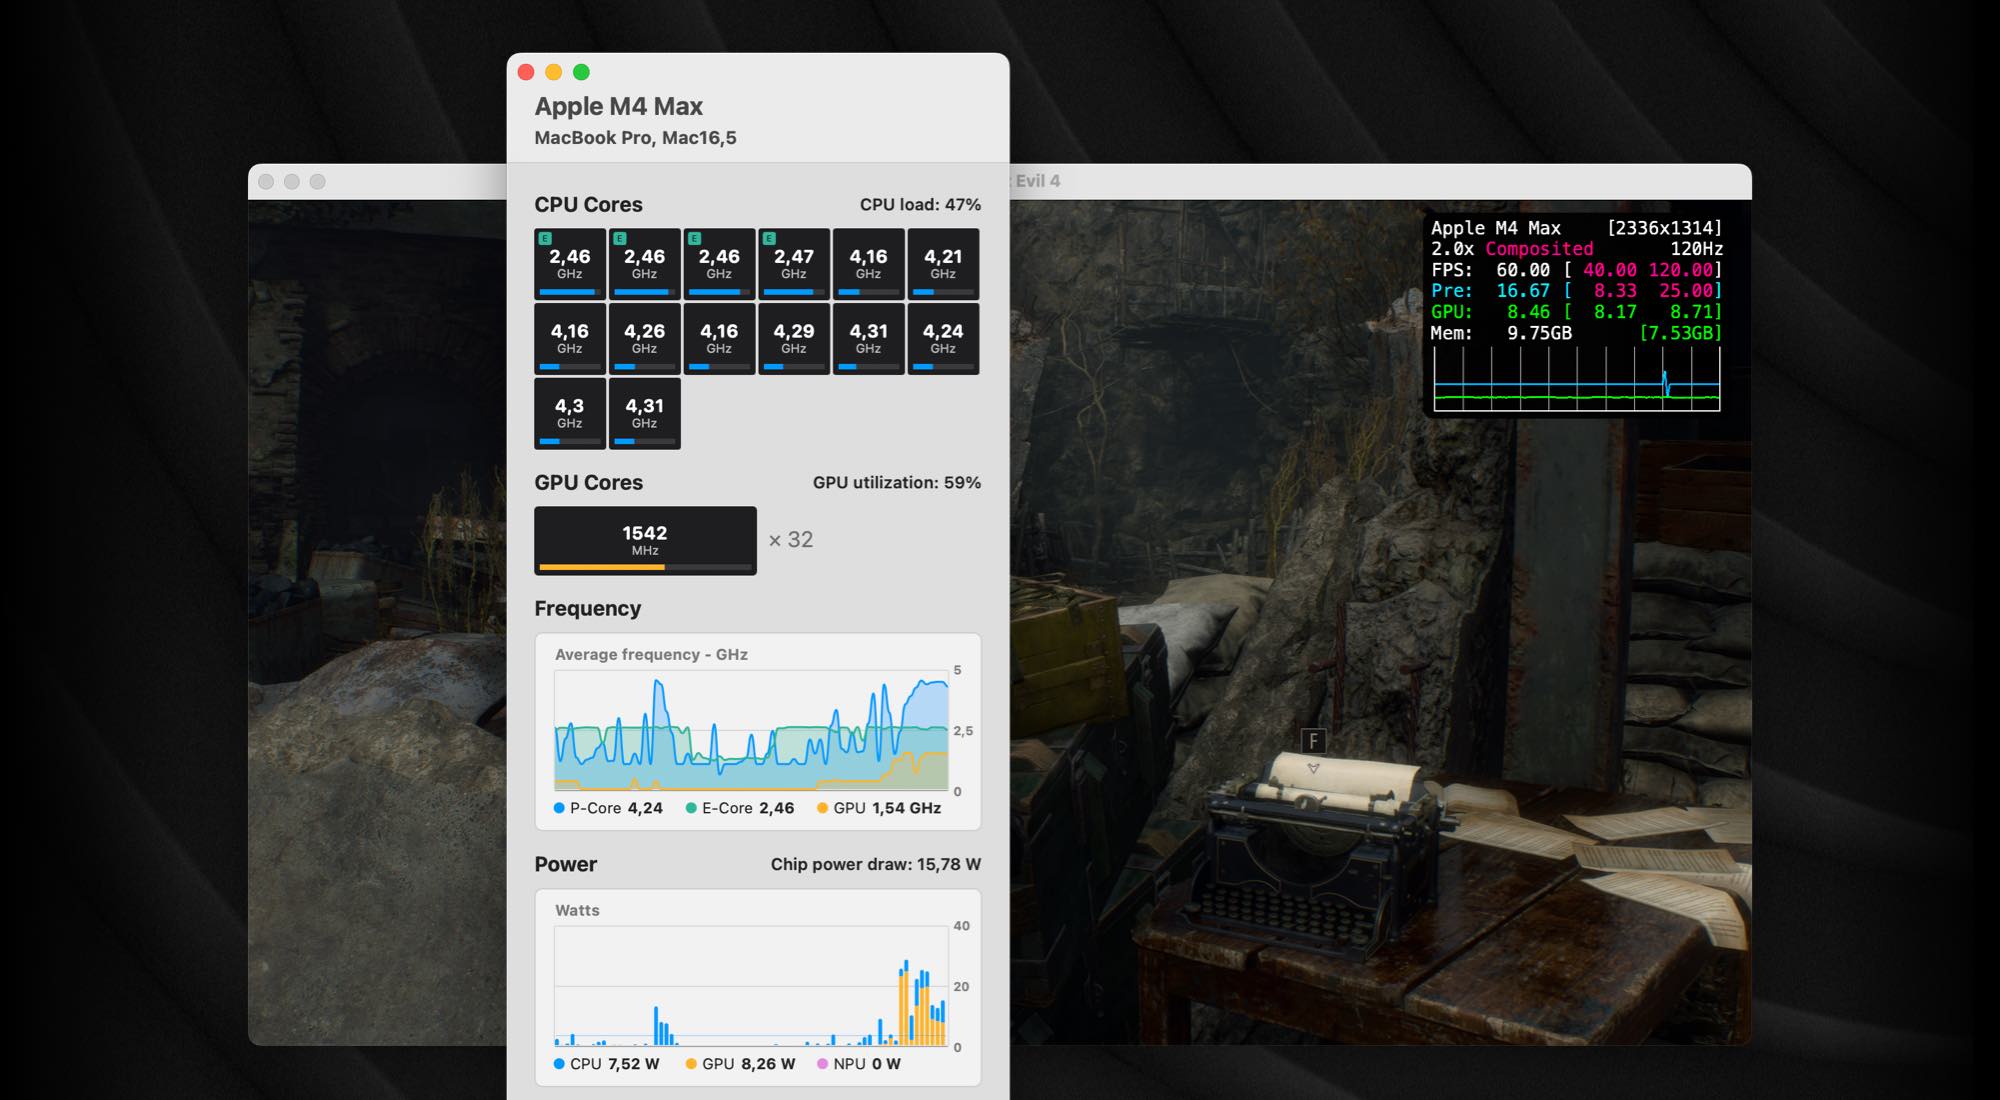
Per-core statistics:
- usage
- frequency
- state
Power draw
Detailed information on chip power draw:
- CPU power history
- GPU power history
- NPU power history
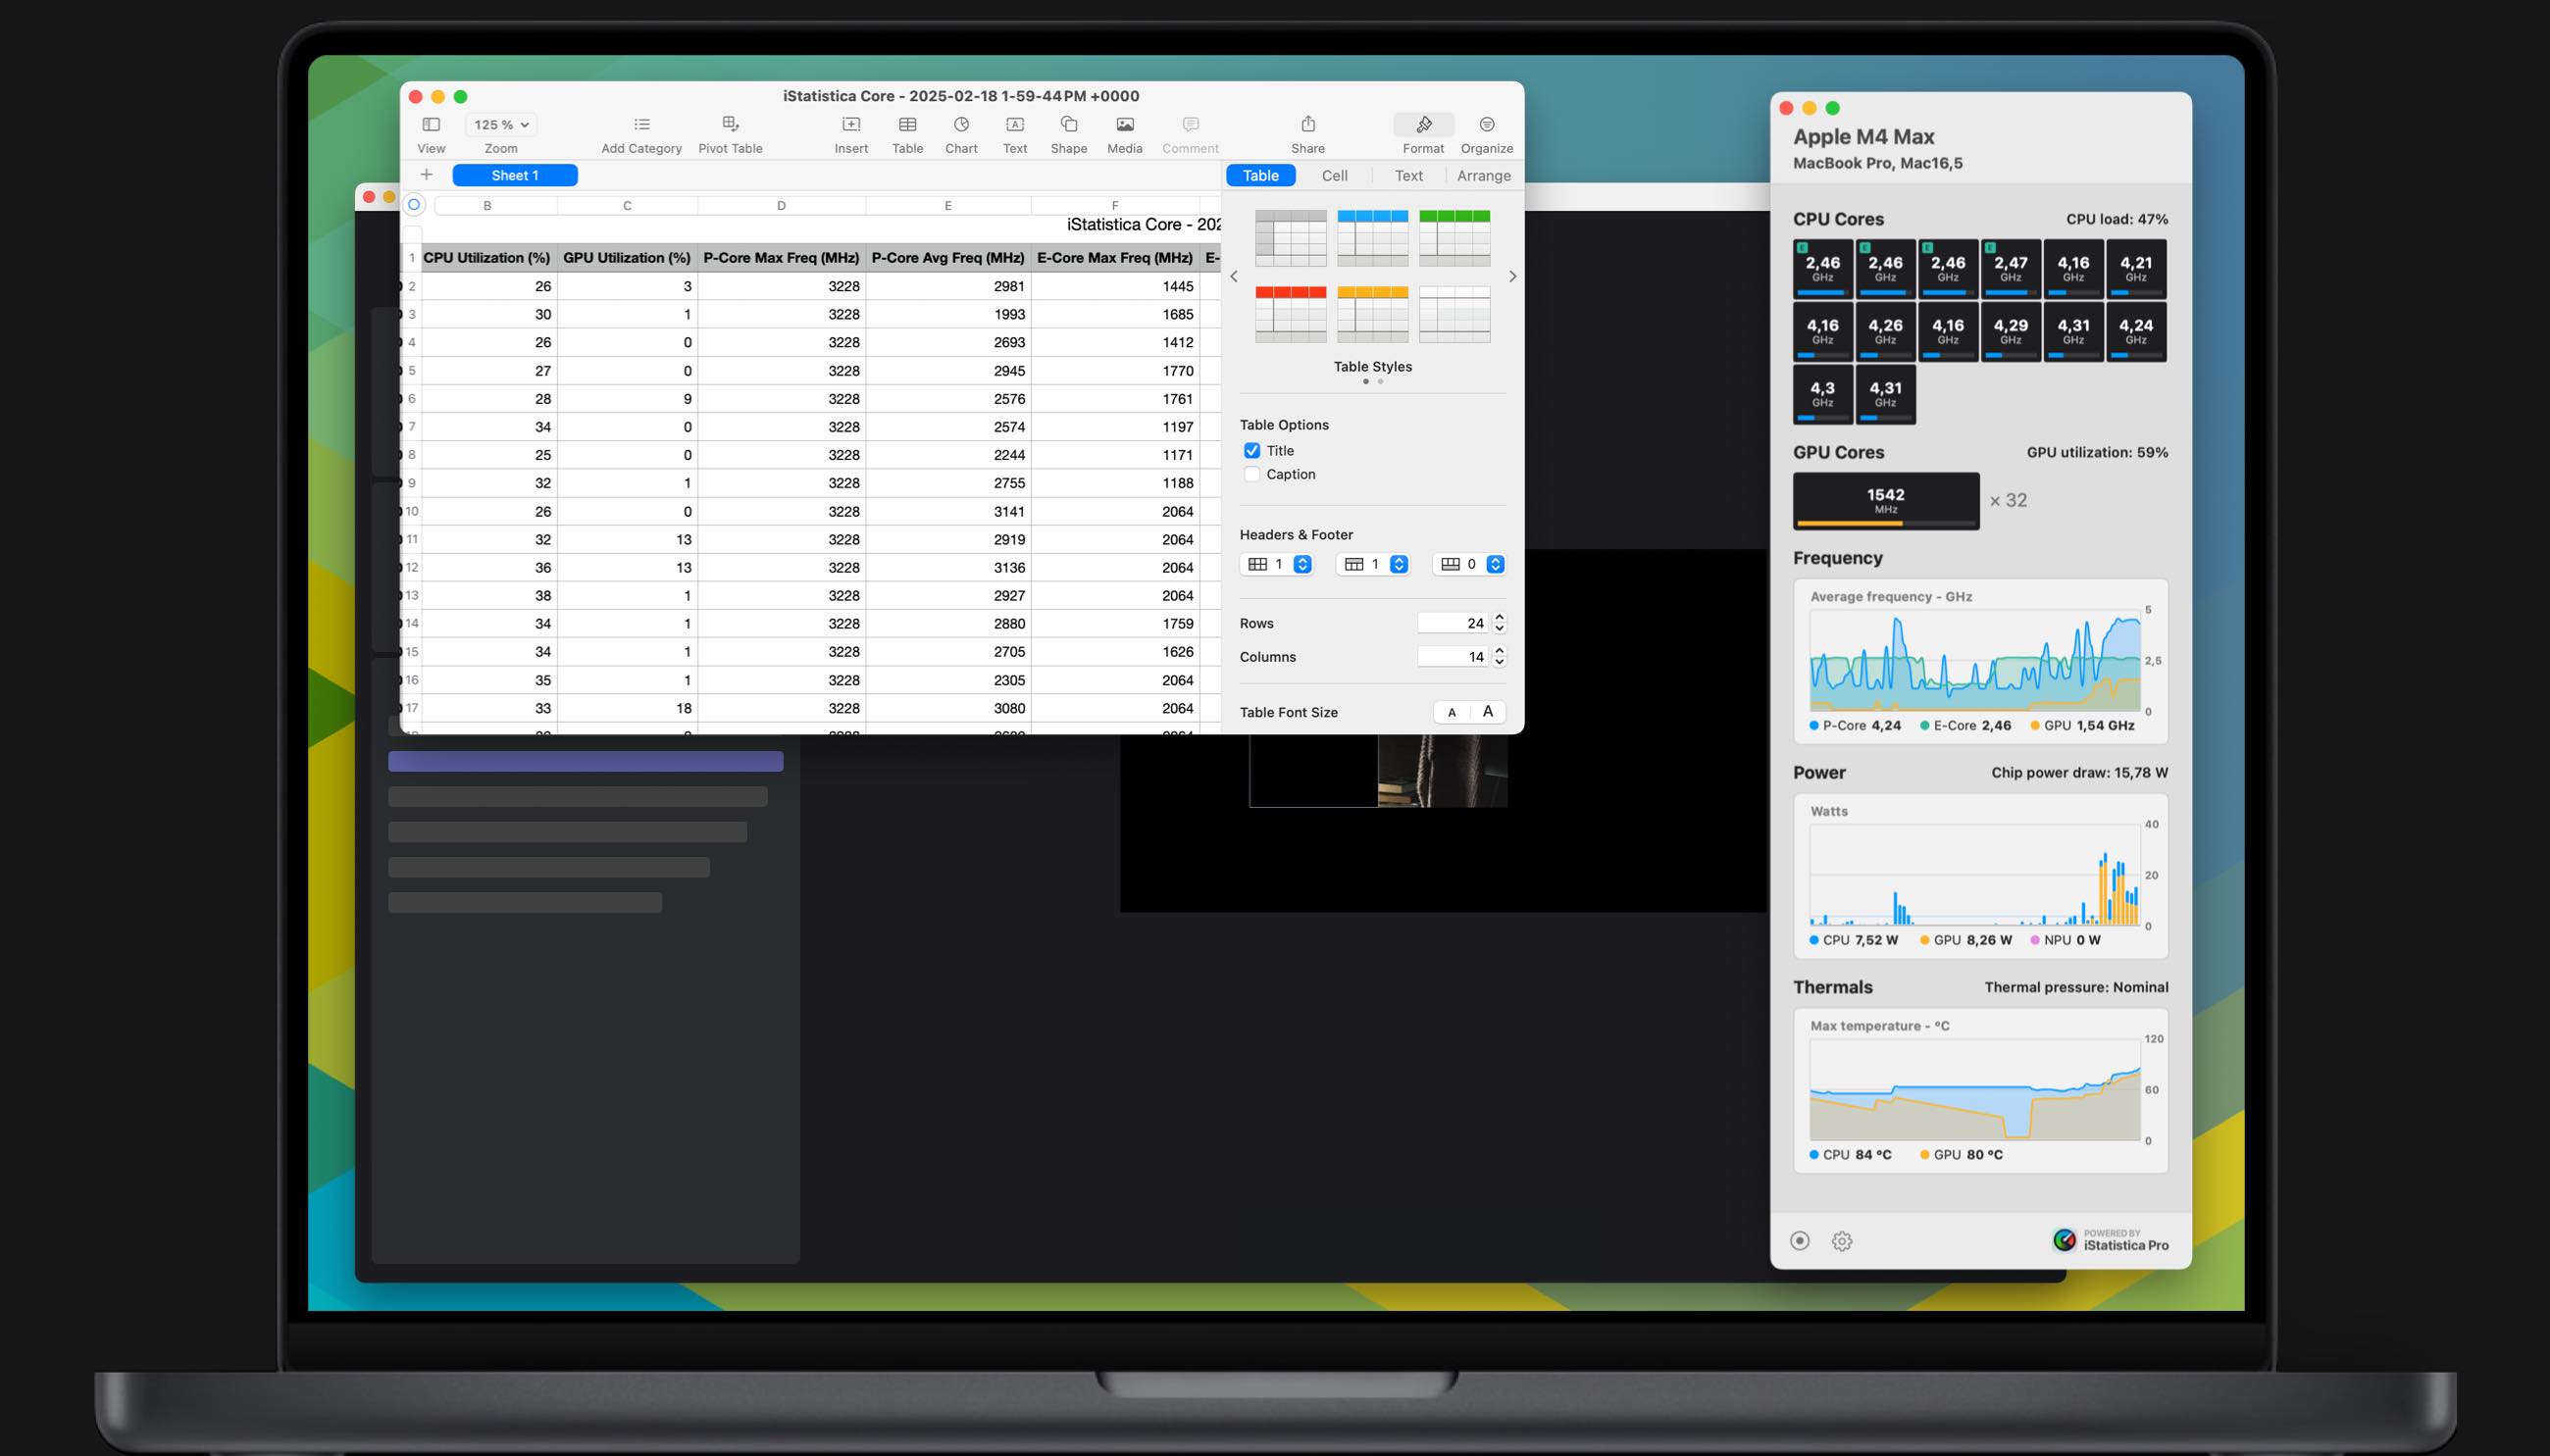
Thermals
Detailed charts of your Mac's temperature:
- CPU temperature history
- GPU temperature history
- Thermal pressure
Frequency
What’s being sent and received, including a bandwidth:
- P-Cores
- E-Cores
- GPU
Ultra-low CPU usage
Low performance impact during benchmarking
- Less than 1% CPU usage
- Less than 0.1 W power consumption
Exportable data
Export all details to CSV in real-time
- frequency
- power draw
- temperature
- 5s interval
Apple Silicon monitoring
iStatistica Core is your ideal companion for reviewing new Macs, extracting every ounce of performance for gaming, or troubleshooting issues.
With iStatistica Core you can see how much energy your Mac is using, view the temperature and detect thermal throttling, or monitor frequencies of Efficiency/Performance and GPU-cores. All statistics data can be recorded and exported to CSV format.
All modern Apple Silicon Macs, including the M1, M2, M3, and M4 models, are supported.
System Requirements
macOS 13 or higher, Apple Silicon only.

Apple Silicon Monitor Support
Found a bug? Have a suggestion? Please, send it to support@imagetasks.com or reach us on X at @imagetasks.
More Apps by ImageTasks

The invisible
Image Viewer and Video Player